Release date:2019-11-18


JACI
[IF:13.1]
Quantification of specific IgE to whole peanut extract and peanut components in prediction of peanut allergy
DOI:org/10.1016/j.jaci.2010.12.012
Peanut allergy is one of the most common, severe, and usually lifelong food allergies, and accurate diagnosis is essential.1x1Sicherer, S.H. and Sampson, H.A. Peanut allergy: emerging concepts and approaches for an apparent epidemic. J Allergy Clin Immunol. 2007; 120: 491–503
Abstract | Full Text | Full Text PDF | PubMed | Scopus (265) | Google ScholarSee all References The double–blind, placebo-controlled food challenge is the gold standard for diagnosing peanut allergy, but the procedure is time-consuming and expensive, and patients might be at risk of a severe reaction.2x2Roberts, G. and Lack, G. Diagnosing peanut allergy with skin prick and specific IgE testing. J Allergy Clin Immunol. 2005; 115: 1291–1296
Abstract | Full Text | Full Text PDF | PubMed | Scopus (197) | Google ScholarSee all References Currently, a level of specific IgE (sIgE) to whole peanut extract of 15 kUA/L or higher is used to predict peanut allergy with greater than 95% certainty,2x2Roberts, G. and Lack, G. Diagnosing peanut allergy with skin prick and specific IgE testing. J Allergy Clin Immunol. 2005; 115: 1291–1296
Abstract | Full Text | Full Text PDF | PubMed | Scopus (197) | Google ScholarSee all References, 3x3Sampson, H.A. and Ho, D.G. Relationship between food-specific IgE concentrations and the risk of positive food challenges in children and adolescents. J Allergy Clin Immunol. 1997; 100: 444–451
Abstract | Full Text | Full Text PDF | PubMed | Scopus (914) | Google ScholarSee all References, 4x4van Nieuwaal, N.H., Lasfar, W., Meijer, Y., Kentie, P.A., Flinterman, A.E., Pasmans, S.G. et al. Utility of peanut-specific IgE levels in predicting the outcome of double-blind, placebo-controlled food challenges. J Allergy Clin Immunol. 2010; 125: 1391–1392
Abstract | Full Text | Full Text PDF | PubMed | Scopus (24) | Google ScholarSee all References but many subjects with peanut allergy have lower sIgE levels.2x2Roberts, G. and Lack, G. Diagnosing peanut allergy with skin prick and specific IgE testing. J Allergy Clin Immunol. 2005; 115: 1291–1296
Abstract | Full Text | Full Text PDF | PubMed | Scopus (197) | Google ScholarSee all References, 5
On the basis of the outcome of oral food challenge, we have recently shown that the majority of children sensitized to whole peanut extract do not have peanut allergy. Approximately 10% of 8-year-old children in our population-based birth cohort in the United Kingdom were sensitized to peanut, but only approximately 2% had peanut allergy, and approximately 8% were sensitized but peanut tolerant.5x5Nicolaou, N., Poorafshar, M., Murray, C., Simpson, A., Winell, H., Kerry, G. et al. Allergy or tolerance in children sensitized to peanut: prevalence and differentiation using component-resolved diagnostics. J Allergy Clin Immunol. 2010; 125: 191–197 (e1-13)
Abstract | Full Text | Full Text PDF | PubMed | Scopus (291) | Google ScholarSee all References By using microarray component-resolved diagnostics among peanut-sensitized children, we demonstrated marked differences in the component sensitization profile between subjects with peanut allergy and peanut-tolerant subjects, with IgE response to Ara h 2 being the most important predictor of allergy.5x5Nicolaou, N., Poorafshar, M., Murray, C., Simpson, A., Winell, H., Kerry, G. et al. Allergy or tolerance in children sensitized to peanut: prevalence and differentiation using component-resolved diagnostics. J Allergy Clin Immunol. 2010; 125: 191–197 (e1-13)
Abstract | Full Text | Full Text PDF | PubMed | Scopus (291) | Google ScholarSee all References However, despite progress in this technology, because of issues related to standardization, cost, and interpretation, this tool is not as yet ready for routine use. In the current study we aimed to compare the quantification of sIgE to whole peanut extract and the peanut components Ara h 1, 2, 3, 8, and 9 using the standard ImmunoCAP method (Phadia, Uppsala, Sweden) in predicting peanut allergy or tolerance.
Of 81 children (age, 7-14 years) with sIgE to whole peanut extract who participated in the original study (29 with peanut allergy and 52 peanut-tolerant),5x5Nicolaou, N., Poorafshar, M., Murray, C., Simpson, A., Winell, H., Kerry, G. et al. Allergy or tolerance in children sensitized to peanut: prevalence and differentiation using component-resolved diagnostics. J Allergy Clin Immunol. 2010; 125: 191–197 (e1-13)
Abstract | Full Text | Full Text PDF | PubMed | Scopus (291) | Google ScholarSee all References 80 had sIgE to Ara h 2, and 66 (27 with peanut allergy and 39 peanut-tolerant) had sIgE to all components. Peanut allergy was confirmed by means of oral food challenge, as previously described.5x5Nicolaou, N., Poorafshar, M., Murray, C., Simpson, A., Winell, H., Kerry, G. et al. Allergy or tolerance in children sensitized to peanut: prevalence and differentiation using component-resolved diagnostics. J Allergy Clin Immunol. 2010; 125: 191–197 (e1-13)
Abstract | Full Text | Full Text PDF | PubMed | Scopus (291) | Google ScholarSee all References Challenge was considered positive after development of at least 2 objective signs (eg, skin rash, sneezing, vomiting, cough, wheeze, and >20% decrease in FEV1).5
We compared the diagnostic performance of sIgE measurement to different components and whole extract in discriminating between subjects with peanut allergy and those tolerant to peanut using receiver operating characteristic (ROC) curve analysis6x6Zweig, M.H. and Campbell, G. Receiver-operating characteristic (ROC) plots: a fundamental evaluation tool in Clinical Medicine. Clin Chem. 1993; 39: 561–577
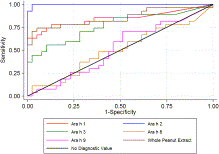
PubMed | Google ScholarSee all References (Stata 11.0; StataCorp, College Station, Tex). Fig?1Fig 1 shows the true-positive rate (sensitivity) plotted in function of the false-positive rate (1-specificity) for different cutoff points for the quantified components and whole peanut extract. Each point on the ROC curve represents a sensitivity/specificity pair corresponding to a particular decision threshold. A test with perfect discrimination has a ROC curve that passes through the upper left corner (100% sensitivity and 100% specificity). Therefore the closer the ROC plot is to the upper left corner, the higher the overall accuracy of the test.6x6Zweig, M.H. and Campbell, G. Receiver-operating characteristic (ROC) plots: a fundamental evaluation tool in Clinical Medicine. Clin Chem. 1993; 39: 561–577
PubMed | Google ScholarSee all References According to this criterion, sIgE measurement to Ara h 2 appears to be the test with the highest accuracy for discriminating allergy from tolerance.
We used estimated area under the ROC curves as an indicator of diagnostic accuracy and observed a significant difference between the tests (χ2 = 61.59, P < .001). As indicated by the estimated area under the ROC curves, sIgE to Ara h 2 had the highest accuracy in differentiating between children with peanut allergy and those tolerant to peanut: area (95% CI), Ara h 2 0.99 (0.99-1.00), whole peanut extract 0.85 (0.74-0.96), Ara h 1 0.84 (0.73-0.95), Ara h 3 0.77 (0.64-0.89), Ara h 9 0.52 (0.37-0.66), and Ara h 8 0.50 (0.36-0.65).
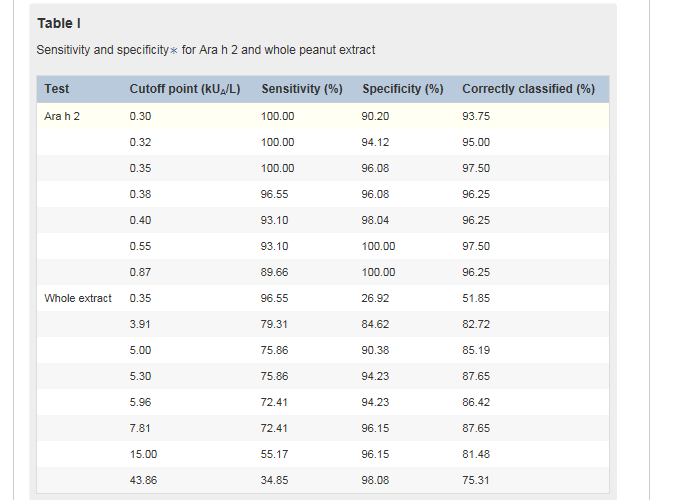
Table ITable I shows a range of cutoff points for component Ara h 2 and whole peanut extract based on sensitivity and specificity because the measure of sensitivity and specificity for a single cutoff point might be inadequate for evaluating the optimal diagnostic test. As an example, we considered a hypothetical scenario in which we are seeking to discriminate allergy from tolerance among 100 children sensitized to peanuts, of whom 50 have peanut allergy and 50 are peanut-tolerant. By using sIgE to component Ara h 2 with a cutoff point of 0.35 kUA/L, all children with peanut allergy would be correctly classified. The specificity of this test is given as 96.1% (Table ITable I). In this example we expect 2 children who are not allergic to peanuts to be misclassified as having peanut allergy and the other 48 children to have a negative result. By using this cutoff point, 97.5% of the population is correctly classified.
A similar proportion of children would be correctly classified by using a cutoff point of 0.55 kUA/L; however, in this case 3 children with peanut allergy would be misclassified as tolerant. This cutoff point corresponds to a gain in specificity (100%) but a loss in sensitivity (93.1%). Given the importance of not misdiagnosing children with peanut allergy as being tolerant, we propose that the optimal cutoff point in our population is 0.35 kUA/L.
The cutoff for whole peanut sIgE of 5.30 kUA/L provides the maximum proportion of correctly classified subjects (87.6%), with a sensitivity of 75.9% and a specificity of 94.2%. However, approximately 24% of children with peanut allergy would be inappropriately classified as peanut-tolerant. The cutoff of 15 kUA/L has excellent specificity, with 96.2% of children at greater than this level being correctly classified as allergic; however, this decision point has relatively poor sensitivity, with almost half of the subjects with peanut allergy being classified as tolerant. These data suggest that in our population the quantification of whole peanut sIgE has lower accuracy in discriminating peanut allergy from tolerance compared with quantification of sIgE to Ara h 2.
In conclusion, having identified sIgE to Ara h 2 as an important predictor of clinical reactivity to peanut using microarray technology,5x5Nicolaou, N., Poorafshar, M., Murray, C., Simpson, A., Winell, H., Kerry, G. et al. Allergy or tolerance in children sensitized to peanut: prevalence and differentiation using component-resolved diagnostics. J Allergy Clin Immunol. 2010; 125: 191–197 (e1-13)
Abstract | Full Text | Full Text PDF | PubMed | Scopus (291) | Google ScholarSee all References we have now demonstrated the value of its quantification using a routinely available laboratory test. Among school-aged children in the United Kingdom, a cutoff of 0.35 kUA/L Ara h 2 IgE confers 100% sensitivity and 96.1% specificity. By using this cutoff point, 97.5% of the subjects in our study population were correctly classified, with all children with peanut allergy given the correct classification. The importance of Ara h 2 has been suggested in studies from other Central and Northern European countries7x7Astier, C., Morisset, M., Roitel, O., Codreanu, F., Jacquenet, S., Franck, P. et al. Predictive value of skin prick tests using recombinant allergens for diagnosis of peanut allergy. J Allergy Clin Immunol. 2006; 118: 250–256
Abstract | Full Text | Full Text PDF | PubMed | Scopus (163) | Google ScholarSee all References, 8x8Flinterman, A.E., van Hoffen, E., den Hartog Jager, C.F., Koppelman, S., Pasmans, S.G., Hoekstra, M.O. et al. Children with peanut allergy recognize predominantly Ara h2 and Ara h6, which remains stable over time. Clin Exp Allergy. 2007; 37: 1221–1228
Crossref | PubMed | Scopus (101) | Google ScholarSee all References; however, in other populations and geographic areas, IgE to other components might be relevant (eg, Ara h 9 in the Mediterranean9x9Krause, S., Reese, G., Randow, S., Zennaro, D., Quaratino, D., Palazzo, P. et al. Lipid transfer protein (Ara h 9) as a new peanut allergen relevant for a Mediterranean allergic population. J Allergy Clin Immunol. 2009; 124: 771–778 (e5)
Abstract | Full Text | Full Text PDF | PubMed | Scopus (144) | Google ScholarSee all References). Our findings need to be replicated in other populations and age groups before general application.
All Author:
Nicolaos Nicolaou Clare Murray Maryam Poorafshar Angela Simpson Adnan Custovic
2019-11- 12 Article
 杭州浙大迪迅生物基因工程有限公司
